Chapter 6
Put it all together
How effective communication helps business partners understand design
Regardless of the design role you’re in now or what your next role might be, the lessons in this book are intended to be universal. While you’ll be faced with different business challenges at every company you work for, the basics remain the same.
So let’s talk about how you can apply them in your current role and organization. Whether using SWOT or SCR, Strategy Maps, or the Negotiation Canvas, these methods and practices are all rooted in the same basic outcome: increasing the business impact of design.
This chapter will share effective ways that you can begin incorporating these lessons inside your organization:
- Integrate with familiar methods and practices
- Introduce a rating scale and scorecard
- Cultivate your consulting skills
- Target appropriate levels of design maturity
Integrate with familiar methods and practices
In social psychology, there’s an effect called the familiarity principle. Basically, it means that people prefer things they’re familiar with over things they’re not.
As a designer, when you introduce a new workshop, research finding, or design, keep this principle in mind. Because your colleagues will be more open to what you share if they’re able to associate it with something they already know.
A smart way of increasing your influence is to incorporate your information into existing processes, meetings, rituals, or presentations. If you do this, your collaborators will feel more comfortable, and they’ll be more likely to sort and classify the information you present in a useful way.
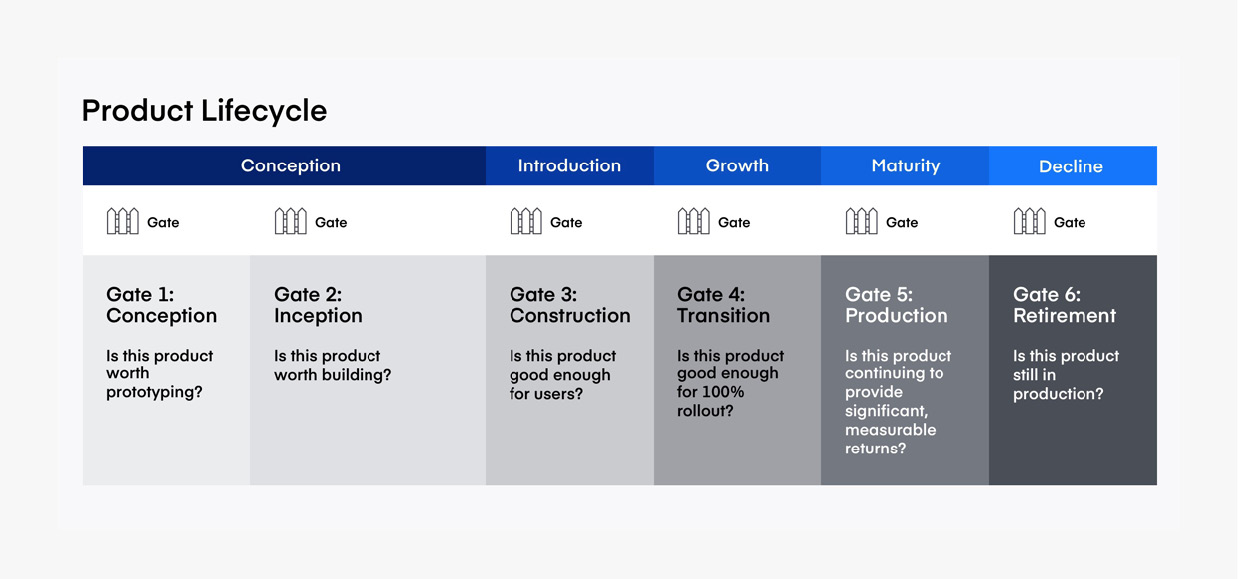
During my time at Electronic Arts, my team worked closely with the IT organization. Our colleagues in IT were very familiar with the phase-gate process (waterfall) of project management. To help transition the team into modern, agile product management processes, we re-used the word phase-gate to introduce new ways of working. For example, “Here are the phase-gates for launching digital products.”
 Figure 6-1: Product Management phase-gates by Ryan Rumsey
Reusing familiar language helped my colleagues understand that decisions had to be made in phases (something also familiar to them) while allowing us to introduce the phases of a product life cycle and the different types of decisions we needed to make (something new).
Pro tip
Integrating these lessons is not foolproof. Like any method or process, they may not work exactly as directed. What level 4 and 5 teams do better than most is test and apply new approaches again and again to learn what works and what doesn’t. Treat these lessons as features to test with your colleagues.
As mentioned in Chapter 1, there’s no linear process for applying the lessons in this book, but my advice is to start with empathy, then visualize the business model and strategy. By doing so, you can quickly assess what is familiar to your colleagues before breaking new ground.
Rather than reinvent the wheel, here are some scenarios for how you can incorporate the lessons into familiar methods and practices.
Scenario: Your collaborators don’t understand how new features or designs will impact the current business model.
Solution: Add EcoSystem Map and BMI triangle activities to Design Sprints or backlog grooming activities. This will ensure that your team understands the impact new features will have on the business model.
Scenario: You’ve struggled to get buy-in for research, recommendations, or new design activities.
Solution: Reverse-engineer presentation decks that have been successful with your stakeholders. Rather than create a presentation on your own, ask your business partners if they can share decks they’ve used in the past to get funding, approvals, or decisions. Modify those with analytical storytelling structures like SCR or SWOT and your stakeholders will better understand your reasoning.
Scenario: You’ve just been re-organized and now report in to a new executive leader, a new team, or a new line of business.
Solution: Developing empathy is one of the quickest ways to understand what your new colleagues do, what problems they’re trying to solve, and what they’ve had difficulties with. Use Empathy Maps after any organizational changes to help you identify how you might be helpful and demonstrate your interest in learning.
As you incorporate the lessons from this book into the existing methods and practices at your organization, you’ll naturally begin to understand the benefits of how your business partners work, despite initial aversions you might have to their processes.
Develop ratings, rubrics, and scorecards
Journey Maps and Service Blueprints are examples of powerful visualization tools that designers have at their disposal. Both communicate comprehensive and detailed analyses of the interactions customers have with companies and the processes organizations use to deliver those interactions. And yet, I’ve seen many business partners struggle to know what to do with the information these tools provide.
In my experience, many design concepts or research insights are often appreciated, but misunderstood by technical and business partners. As a result, organizations can struggle to incorporate important context into prioritization and decision-making activities.
One of my favorite ways to provide clear, accessible context is to establish a rating scale with rubrics. If you recall from Chapter 4, desirability factors like usability or credibility influence adoption, and rating scales successfully communicate how they’re being addressed.
Rating scales and rubrics
Simply put, a rating scale is a set of categories with an associated value for a feature, a product, or an experience. Common in surveys, psychological assessments, or education, rating scales are also popular for business measurements like Net Promoter Score or Customer Satisfaction.
Rubrics, on the other hand, are the criteria used to evaluate overall performance. They consist of a rating scale and a detailed description of the characteristics for each level of performance. These descriptions focus on the quality of performance.
A common measure of usability is how well users can complete tasks. Here’s an example of a rating scale with rubrics to help determine the quality of task completion:
- Does not complete task
- Successfully completes task with a lot of support
- Successfully completes task with some support
- Successfully completes task with minimal support
- Successfully completes task as expected
An effective way to monitor and track usability or accessibility improvements over time is to present the status of these ratings through a scorecard.
What is a scorecard?
You’re probably familiar with scorecards as a concept. In the sports world, scorecards keep official records of play-by-play action with a tally of hits, catches, runs, outs, passes, fumbles, goals, etc. What you may not know is scorecards are common in the business world as well.
One of the most popular business concepts over the last 30 years has been The Balanced Scorecard. Developed in the early 1990s, The Balanced Scorecard was popularized by Robert S. Kaplan and David P. Norton in their book of the same name. The concept itself is billed as a semi-standard report that can be used to track and monitor execution activities across a variety of products or services.
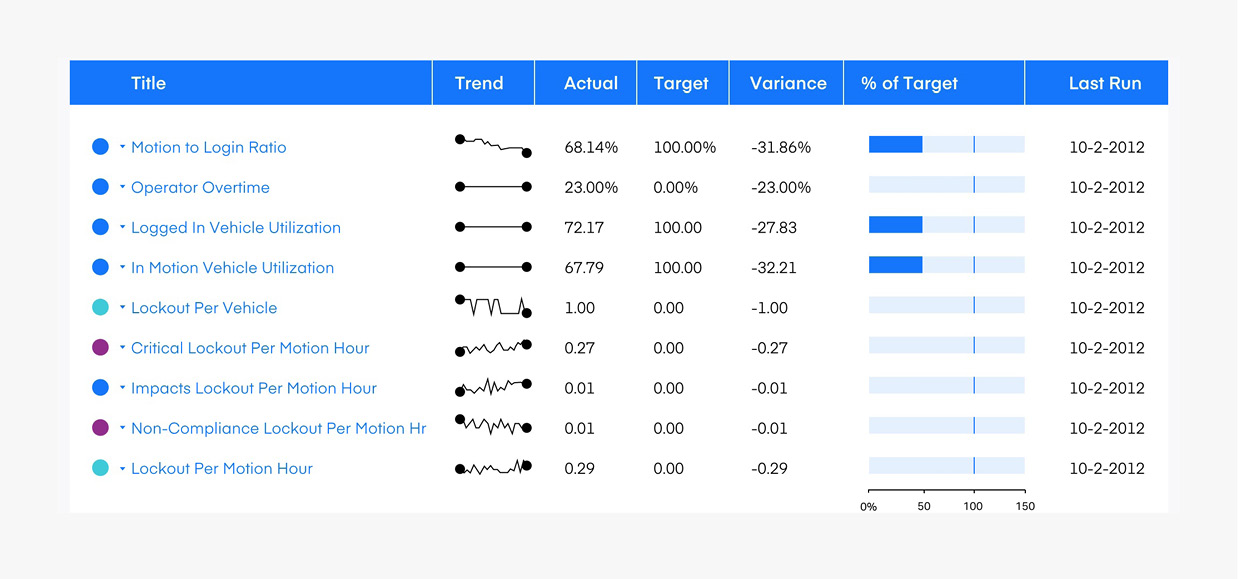
Many management teams across industries use scorecards to monitor and track both financial and non-financial objectives and key results. But unlike game scorecards, organizational scorecards are not meant to actually keep score, but rather to identify gaps and deficiencies that need priority attention. If you’ve ever been in a meeting with senior leaders or executives and they’re using an excel sheet or dashboard with a bunch of red, yellow, and green, that’s a scorecard!
 Figure 6-2: Example scorecard by Greenooo [CC BY-SA https://creativecommons.org/licenses/by-sa/3.0]
Ultimately, it’s the information inside a scorecard that’s important. And this is where you’ll embed rubrics and rating scales to regularly update your product managers, engineers, and executives.
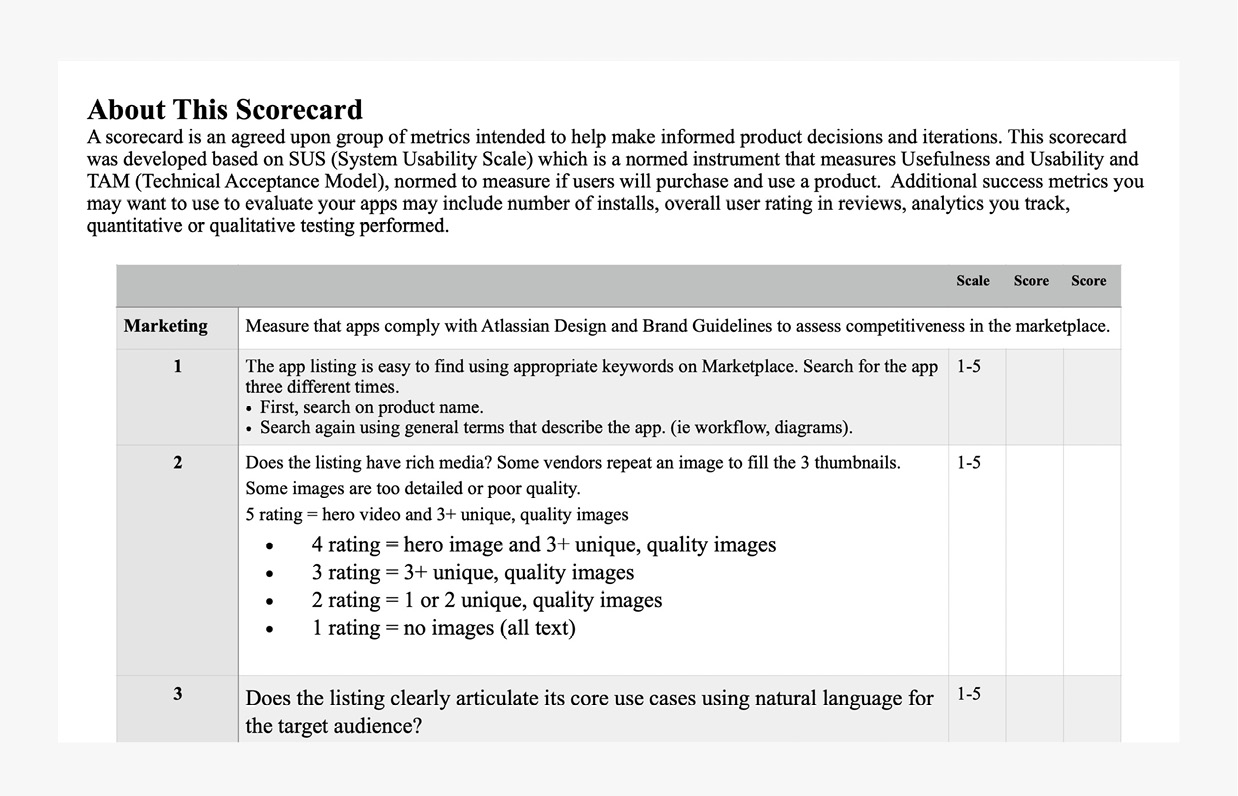
 Figure 6-3: The UX Scorecard by Atlassian is a great resource for maturing your approach to app improvements.
While ratings and rubrics really help with improving the quality of products, business leaders can struggle to connect small product improvements to the overall business. That’s because the pace of the organization is different than the pace of a product.
Improvements to products are frequently released in weekly or monthly cycles, while the strategic reviews, project funding, or financial reporting of a company is often done in quarterly, bi-annual, or annual cycles. At the product level, improvements may show up quickly through testing, but longer term effects of those improvements may take months or more to show up at the organizational or business level.
Pro tip
Scorecards take time to develop and mature. To gain buy-in for introducing them, I recommend using analytical storytelling to present the risks and opportunities of having scorecards (or not) to track improvements.
Create a design scorecard
Mature design teams don’t just experiment before going to market, they measure the effects of the designs in the market over time.
Design scorecards are effective reports for showing the impact and results of overall design work. They are also an incredibly effective way to help cross-functional partners prioritize key factors like credibility or usability, because they connect project or product level deficiencies to the portfolio level.
I first learned about scorecards while I was at Apple. My colleagues in Program Management were using Balanced Scorecard reports to communicate their progress to executive leadership. Fascinated, I did some research on the origins of the approach and began to prototype different types of reports for design activities using the same approach.
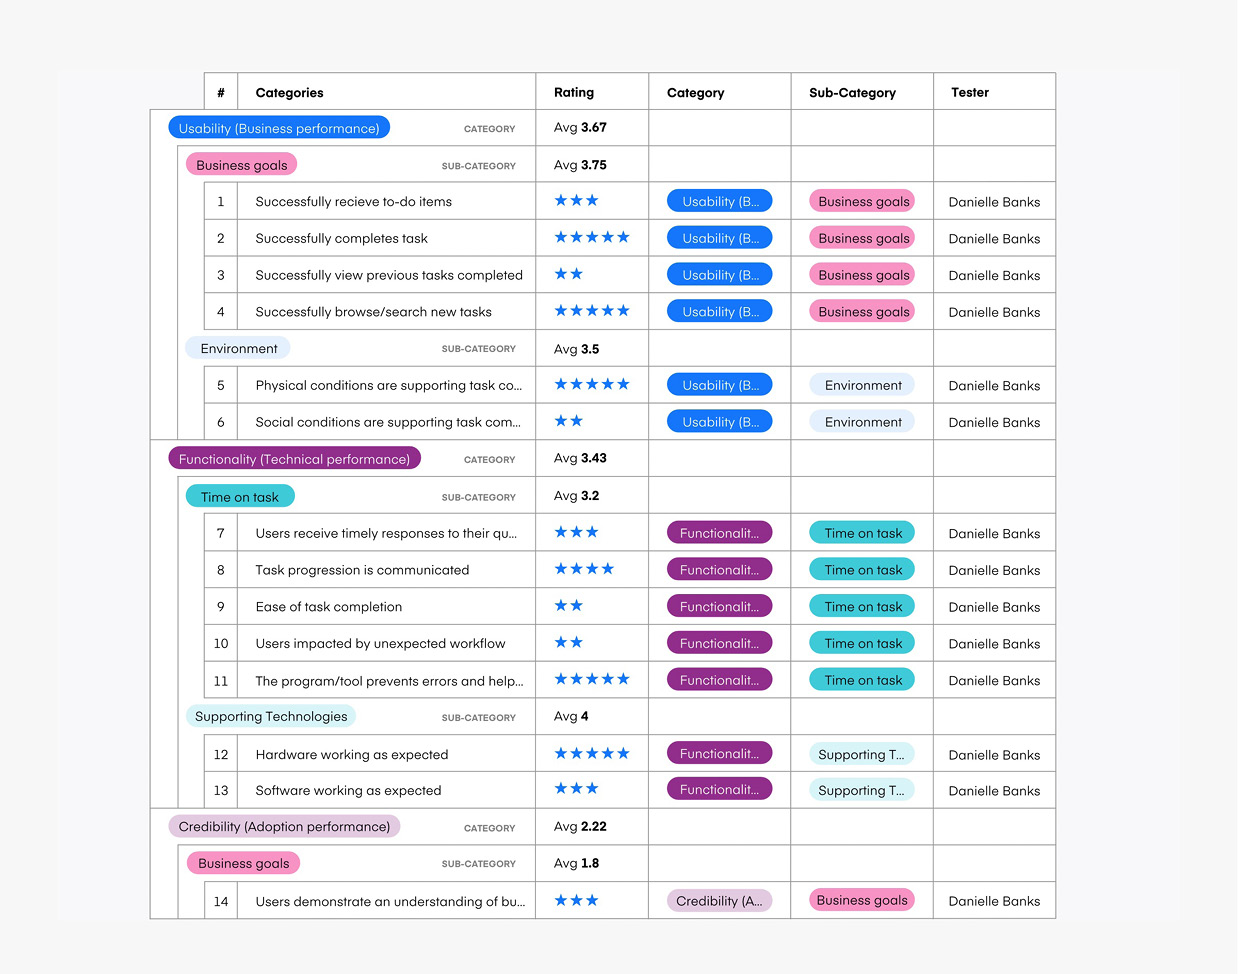
 Figure 6-4: The Desirability Scorecard by Ryan Rumsey
By establishing a rating system for design efficacy across products, design teams can communicate the impact of their work at both a product and organizational level, even while using different rubrics or metrics. A standard rating communicates both a point-of-view for trade-off decisions and helps to audit the design team’s ability to expose priority areas of need.
Over the last 10 years, I’ve refined my own scorecard approach to track and monitor design OKRs, KPIs, etc. to communicate the impact of design. This approach has been the core of my work with companies and design leaders since launching Second Wave Dive in 2019.
Incorporate a consultant mindset
Are you able to let your colleagues come to their own conclusions?
Some of the most effective designers I know practice the art of letting other people have their way. They’ve learned over the years that by allowing their colleagues to put ideas or thoughts on the table, they remove any anxiety those colleagues might be having about a negotiation. Once that anxiety is removed, these designers are in a much better scenario to present alternative ideas as amendments or add-ons to the original idea rather than in opposition. Similarly, I’ve noticed over the years that great consultants (regardless of their background) are also really good at letting others come to their own conclusions.
To develop this mindset, learn how to ask open-ended questions about the current state of affairs before jumping into solution mode. Some questions I’ve used in the past:
- How does this impact the business?
- How are you measuring improvements right now?
- What are the risks of not doing anything at all?
- If you had to choose an item to work on first, what would you choose? Why?
Consultants are also strong influencers because they think like executives. Many of the lessons in the book represent ways I’ve been able to develop my ability to think like an executive, which ultimately helped me become one.
One of the most important things to remember is that executives have limited time. They’re schedules are full, days are endless, and they need help processing information quickly. Designers who can communicate concisely and effectively are more likely to get invited back to future discussions.
Pro tip
Consultants are able to highlight the risks and opportunities involved in decisions and they know that every decision has both. When you work with collaborators and leadership teams, show data and rationale to support your reasoning by consistently highlighting the risks and opportunities of a decision.
In conclusion, the consultant mindset is focused on making sense of confusing and complex situations. Ask yourself, “Am I adding to the confusion, or relieving it?” If you’re adding to the confusion, work on acting like a consultant. If you’re relieving it, you're going to be a successful design leader!
Assess and target the appropriate level of design maturity
Conclusion
My hope is that, after reviewing the lessons and tips I’ve recommended, you not only feel better equipped to work with colleagues, but you also feel some relief about your day-to-day responsibilities.
By developing a business perspective, you know how to anticipate the needs and behaviors of your colleagues. You know how to visualize your business to learn your business. You recognize that meaningful, productive, ethical, and transformative designs also need to create competitive advantages. Finally, you know how to speak in the languages that help your colleagues understand the full value of design.
While these tips provide pragmatic steps, leveling-up design maturity takes time. You’re part of a journey, and with these skills, you’ll be in a position to progressively impact your organization in exciting new ways. As you begin to use what you’ve absorbed here, you’ll not only be seen as an effective designer, but also as an effective collaborator.
Thank you for inspiring me to share what I’ve learned. I can’t wait to see what your future holds!
Further reading
- The Balanced Scorecard by Robert S. Kaplan, Harvard Business School professor of accounting
- The UX Scorecard for Apps by Lori Kaplan from Atlassian
- What Consultants Do by John Kim from Consultants Mind
