
Chapter 4
Create conditions for design maturity
Gain perspective of how design connects to business
InVision’s groundbreaking report, The New Design Frontier, explores the behaviors, practices, and outcomes of high-performing teams in ways that support the ideas in this book. The report identifies five organic levels of design maturity at which design has increasing levels of influence on a company’s bottom line.
One of the biggest jumps design teams strive to make in their maturity is moving beyond design as a service for basic aesthetics and creative problem-solving techniques (Levels 1, 2, and 3) to a model in which design collaborates in strategic decision-making (Levels 4 and 5). I’ve seen many design teams stuck at Levels 2 and 3 because they’re unable to correlate more advanced design activities to business outcomes.
A key paragraph from the report describes what’s necessary for teams at the third level of maturity to progress further:
When organizations establish the right conditions for design and make room for it in core processes, they also experience deeper customer understanding, bolder exploration and experimentation, and more informed decisions vetted through the continuous testing and learning process design enables.
 The New Design Frontier report from InVision
The phrase that catches my attention is, “When organizations establish the right conditions for design and make room for it in core processes...” I’ve never seen an organization organically instill these conditions for designers. To make it happen, designers must step outside their comfort zones and learn the business.
There’s a reason companies like Netflix, Nike, Patagonia, and Tencent continually produce inspiring products, services, and innovations: They have mature design teams that connect their work to the ultimate outcome of their organizations—winning in competitive markets.
The designer’s job is to create a competitive advantage
To win in the market, organizations need a competitive advantage: A condition or circumstance that puts them in a better business position than the rest of the field.
If you recall Porter’s Generic Strategies from Chapter 2, there are basic strategies—such as price—that an organization uses to position itself. Beyond these, organizations use more specific business models and strategies to gain a competitive advantage that’s unique to them.
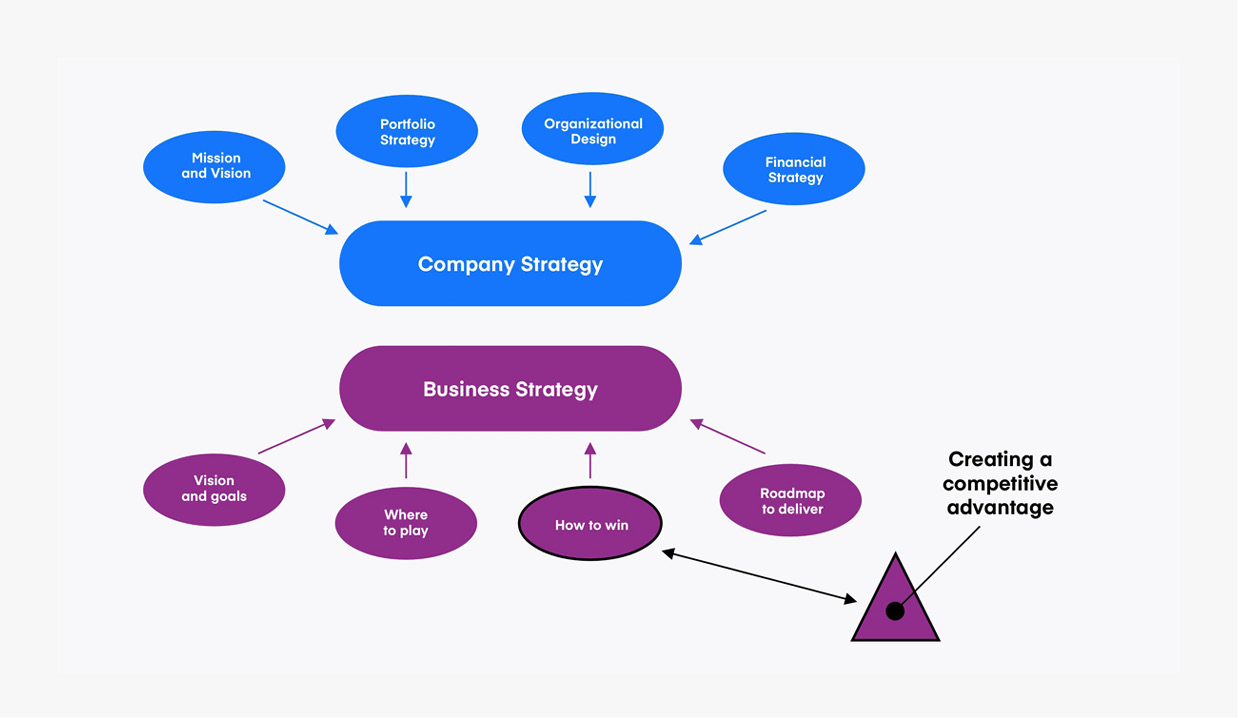 Figure 4-1: Innovations, products, and services are types of approaches companies take to gain competitive advantage, but there are other approaches
Whether you work at a for-profit or non-profit, the designer’s job is to help the organization “win” by creating a competitive advantage. That’s the perspective of the C-suite.
It’s challenging to show executives how the work you do creates meaningful, productive, ethical, and transformative value for customers and achieves a competitive advantage. Establishing the “right conditions” to build maturity means that you must clearly demonstrate how your work with aesthetics, interactions, stories, and brands connects to the company’s bottom line. In this chapter we’ll discuss ways that you can do this:
- Update the Venn diagram
- Visualize the perspectives of desirability
- Connect desirability and viability objectives
- Create a cause-and-effect model with conditional statements
- Quantify results with experimentation
Update the Venn diagram
Terms like innovation, success, and adoption are used a lot in business, but their meanings vary depending on who you’re talking to and their type of organization. Clearly defined and shared definitions for terms is one of the “conditions” necessary for design teams to reach higher maturity levels. It’s a necessary foundation for designers to communicate the value of their work. One way to establish this foundation is to connect these terms to a competitive advantage. Here’s an example of what I mean.
Innovation is one approach to gaining a competitive advantage, and designers are regularly included in these decisions. But designers are often shut out of the process when other approaches are considered. For example, when an insurance company decides to reduce its prices for coverage, or a bank targets frequent travelers for a credit card offer, or a hardware company updates its supply chain.
Shutting designers out of these decisions isn’t malice; it’s a lack of trust. Many organizations aren’t prepared to trust designers beyond aesthetics or problem-solving techniques because designers, by in large, don’t speak about their work in terms of competitive advantage. This is where one of our most sacred Venn diagrams lets us down.
Business + engineering + design = innovation
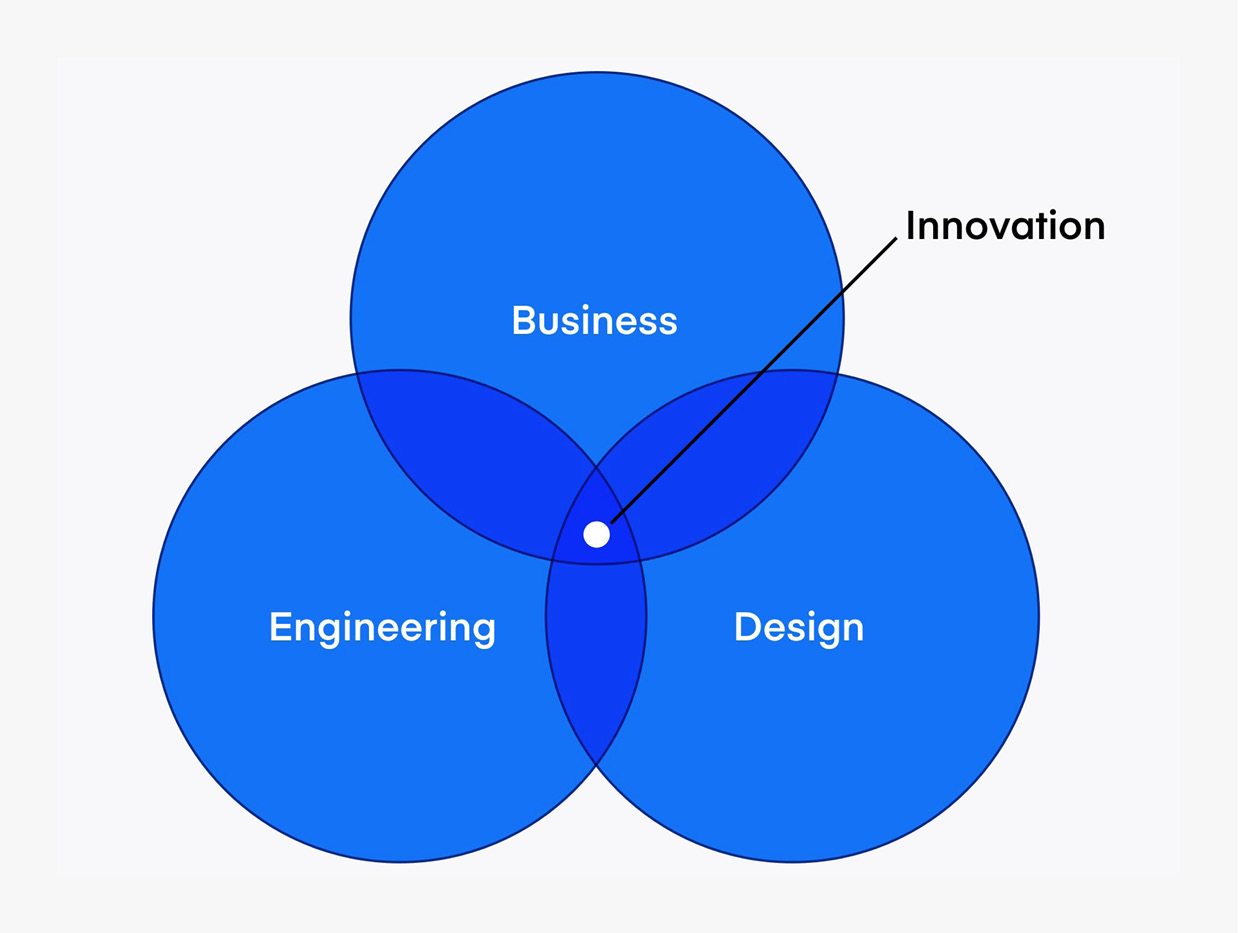 Figure 4-2: The sacred Venn diagram of innovation
From a historical perspective, this visualization has been important to promote the need for design to join engineering and business as core innovation disciplines. This promotion has worked. Organizations leverage Design Thinking methods and hire designers to create seamless, beautiful, engaging, and organic customer experiences. However, the diagram is outdated. It oversimplifies how complicated it is to create products and services, and pigeonholes designers into a limited perspective of what innovation means. It does this because it fails to communicate the most basic of business expectations: the link to competitive advantage.
Organizations regularly and wrongly assume that business, engineering, and design functions are enough to create a competitive advantage. But a competitive advantage is only obtained when the characteristics of these functions combine to create desirable, feasible, and viable solutions.
By updating the diagram to reflect this, we can reframe the conversation about the value and fit of design in the organization. This reframing is an important first step in establishing greater trust with our cross-functional colleagues.
 Figure 4-3: An updated Venn diagram for competitive advantage by Ryan Rumsey
Business becomes viability. Engineering becomes feasibility. And design becomes desirability. Shifting to desirability means moving away from discussions of aesthetics and towards discussions of what customers actually need and want: desirable solutions.
In addition to evolving organizational functions to product/service characteristics, we should also expand the definition of “innovation.” The word innovation is undeniably exciting to all parties, but when it’s abstract and poorly outlined, it doesn’t merit trade-off decisions.
Innovation is the act of introducing something new or unique. But your organization needs more than this. It needs adoption to validate competitive advantage. This is the value of good design, because desirable solutions are adopted solutions.
Consider this extrapolation of the updated diagram:
- A viable solution, one that’s good for our business
- A feasible solution, one that can be executed by our team
- A desirable solution, one that will be adopted by our customers
Designers who speak to partners about desirability, adoption, and competitive advantage gain trust faster than those who don’t. That said, desire is complex and you need simple ways to describe its unique makeup. That’s what we’ll cover next.
Pro tip
If you have a business partner who asks why you’re not “doing it like company X,” a great response is: “Because we’re not designing for the values of company X and their customers. We’re creating a competitive advantage for us.”
Visualize the perspectives of desirability
What is desirable? This is one of the first questions I ask when I join a company, consult with design teams, or mentor design leaders.
I have yet to ask this question and get the same answer twice. Within an organization, this lack of consistency puts designers and design teams into difficult situations. Business partners expect to get the same answer to this question from every designer in a company. Why? Because designers are ambassadors of desirability for their organization.
Time and time again, I see designers on the same team or in the same organization give different interpretations of what makes a product or service desirable. This confuses business partners and makes them believe desirability is subjective—and therefore unworthy of trust in decision-making.
How do we fix this situation? In my experience, the tools we use to conduct our analysis and develop insights are too complex to share with business partners. Plus, they don’t really remove the subjectiveness of desirability. Journey Maps and Service Blueprints are incredibly powerful and useful. But they don’t directly show how improving an experience leads to objectives and goals for adoption.
So we have a communication gap. Product teams, stakeholders, and executive leadership struggle to connect the dots between desirability and adoption. Strategy Maps are the bridge we need.
What are Strategy Maps?
Strategy Maps are one of my favorite business visualizations. Simple in structure, a Strategy Map shows the relationships between organizational objectives through underlying quality perspectives.
Strategy Maps were originally popularized in the 1990s as part of a strategic management framework called The Balanced Scorecard. Now they’re a popular tool for describing and visualizing business strategies at companies large and small.
Traditional Strategy Maps connect objectives between the four separate perspectives of company health outlined in Chapter 2:
- Financial
- Customer
- Operations
- Learning & growth
The visualization creates a template for how objectives within the different perspectives relate to one another. For example, how developing employee skills relates to improved operational efficiency, which leads to better customer solutions and generates financial value for the company.
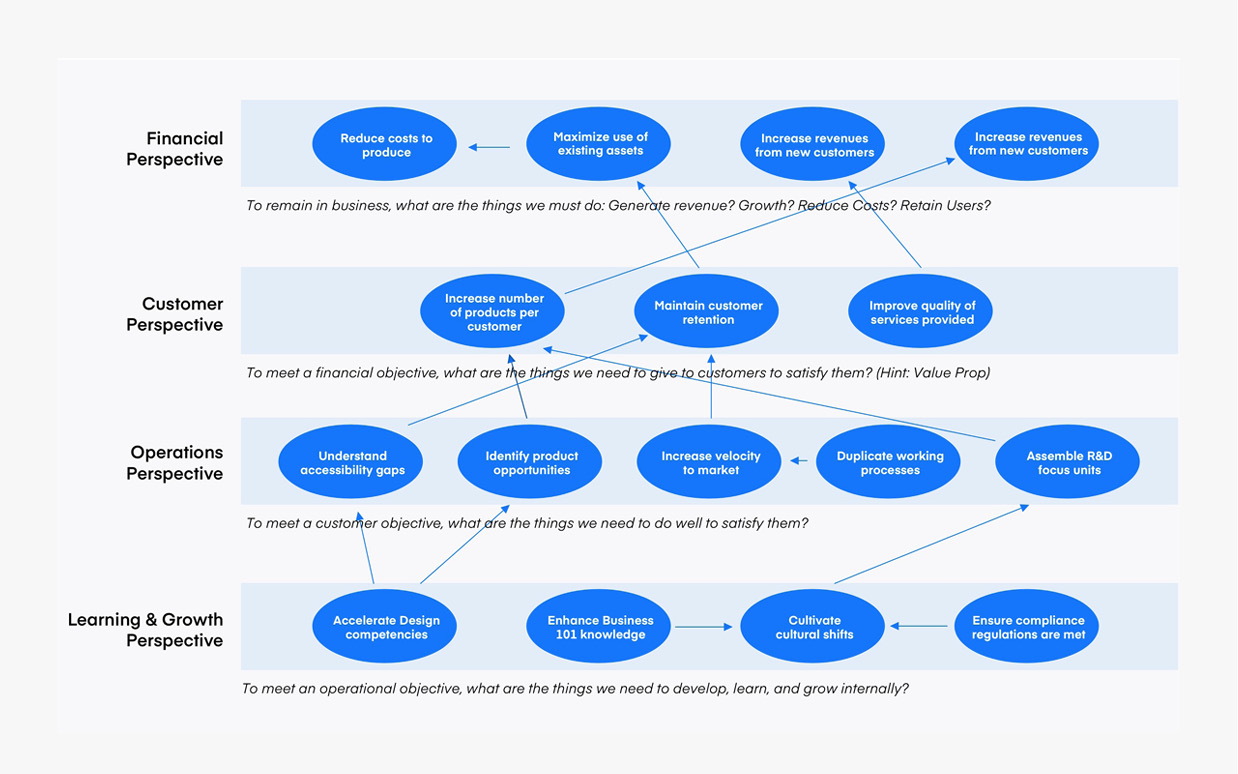 Figure 4-4: A hypothetical example for a business Strategy Map by Ryan Rumsey. At first glance, Strategy Maps can be a little daunting, but by following the arrows we can see how a host of different objectives build on one another
The order of perspectives in Strategy Maps matter because it indicates priority in trade-off-decision scenarios.
- Financial: To remain in business, what are the things we must do? Generate revenue? Grow? Reduce costs? Retain users?
- Customer: To meet a financial objective, what do we need to give customers to satisfy them?
- Operational: To meet a customer objective, what things do we need to do well?
- Learning & growth: To meet an operational objective, what are the things we need to develop, learn, and grow internally?
Developing Strategy Maps is one of the most effective ways to foster the maturity of design teams. Not only do they play to our strength—visualization—but they also unite designers around a common point of view that is vastly superior to an array of personal opinions or feelings.
Now I’ll show you how to create a Strategy Map that communicates your team’s definition of desirability and helps to clarify how designers impact competitive advantage differently than other functions in the business.
Did you know?
Many large organizations already have Strategy Maps for the business. Ask around, get your business partners curious, and see if you can find out if they exist.
Four perspectives of desirability
After 10 years of creating Strategy Maps for design teams, I’ve settled on a format that creates a clear viewpoint on how desirability factors influence adoption.
I use only four perspectives in order to keep things simple for my business partners. And I’ve been able to align most desirability objectives within them without any problem. These perspectives, in order of importance:
- Credibility: To drive adoption, what are the things that need to be credible for the user?
- Impact: To meet a credibility objective, what are the things that must create impact?
- Usability: To meet an impact objective, what are the things that must be usable?
- Detectability: To meet a usability objective, what are the things that must be detectable?
I can’t stress this enough: The order of these perspectives is important.
If you want your organization to prioritize factors like ethics or accessibility, you need to first emphasize these perspectives. I place credibility above all others because, ultimately, factors like trust, accuracy, and good intentions matter more than usability. If a customer doesn’t believe your product or service is credible, they’ll quickly take their business elsewhere.
This setup gives design teams an initial outlook on what desirability is: a detectable, usable, impactful, and credible customer experience.
Pro tip
While I find these four perspectives on desirability to work quite well, you might want to consider your own. Here’s a design team activity to do that. I call this exercise Best Product Ever. Prompt team members to think of the best product they have right now and ask each to find four words describing why it’s the best. Use Post-its and affinity diagrams to converge on four perspectives that work for you and your business partners.
Create desirability objectives
After you establish your four perspectives, it’s time to capture two to three strategic objectives for each perspective. These objectives are where you clearly associate values like the environment, trust, society, ethics, diversity, or inclusion with the importance of usability, functionality, or aesthetics.
The easiest way to express an objective is with a phrase that combines a verb and a specific noun. For example, “improve trust,” “increase inclusion,” or “reduce errors.” Once you’ve captured your team’s goals, align each to the specific perspective with a simple chart like the one below.
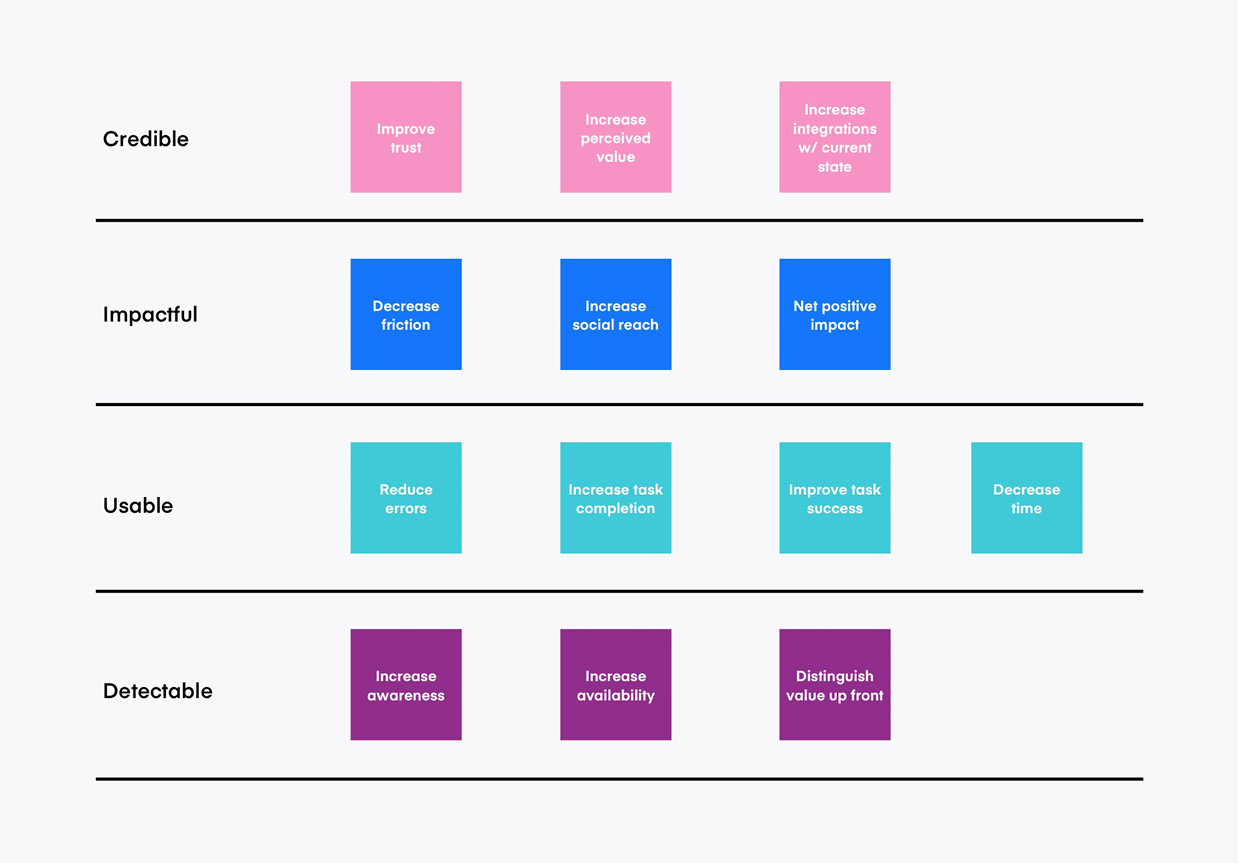 Figure 4-5: Desirability, strategic perspective, and objectives by Ryan Rumsey
As you add objectives, a more refined model of desirability emerges. But we’re not done yet. To integrate with the rest of the business, we need to link desirability to viability. We do this with two elements: arrows and conditional statements. I’ll show you how in the next section.
Link desirability to viability with conditional statements
A common dilemma designers face is when a colleague who has not participated in observations provides a conclusion. When this happens, your other colleagues do what’s natural: they base their own guess on their past experiences or prior knowledge. This is problematic because it leads to inaccurate conclusions across the board and difficult political situations.
One common approach to working through this dilemma is to expose colleagues to users. But another helpful approach is to show your logical reasoning. Conditional statements are a great way to do this.
Conditional statements are formed by connecting two separate statements. The first provides a hypothesis and the second, a conclusion. If you’ve ever developed an app or written code, you’re familiar with “if/then” and “if/else.” These are examples of conditional statements.
Conditional statements create a cause-and-effect model in which being successful with one statement promotes the success of the other. This is where the beauty of visual diagramming comes into place. Rather than trying to write out these statements, you can illustrate them using arrows.
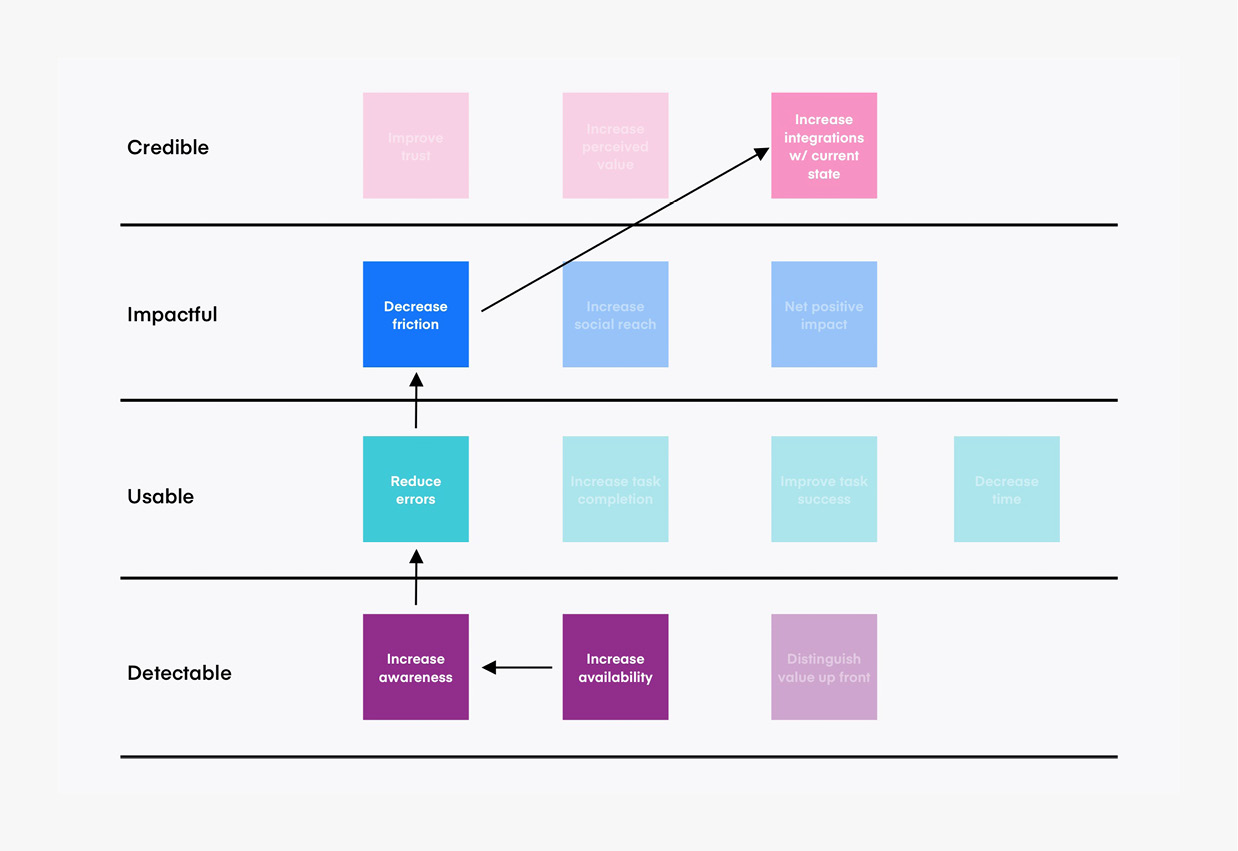 Figure 4-6: A cause-and-effect model of desirability objectives by Ryan Rumsey
To illustrate a single conditional statement, simply draw how you believe the objectives connect to one another. The goal is to draw out multiple statements like this, moving from objectives at the bottom to the top.
Here’s an example of how one of these conditional statements might be written out:
If we increase our availability, then we will increase awareness, which will reduce errors, and in turn, decrease friction to result in increased integrations.
While it may not be perfect, it’s one complete conditional statement of why desirability matters and how specific objectives relate to overall adoption. We’ve now reached the point where we can make the breakthrough connection to viability.
Connect desirability objectives to viability objectives
Now that you have your conditional statements for desirability, another Strategy Map will help us show the relationships between desirability and viability. Begin by isolating one conditional statement for desirability and creating a second, adjacent column (see below).
Remember those four perspectives of company health? Those are the underlying perspectives of viability. Like the perspectives we captured for desirability, we have to stack rank the perspectives of company health. If you’re working at a for-profit company, the order is: Financial, Customer, Operational, and Learning & Growth. For a non-profit, Financial moves to the bottom.
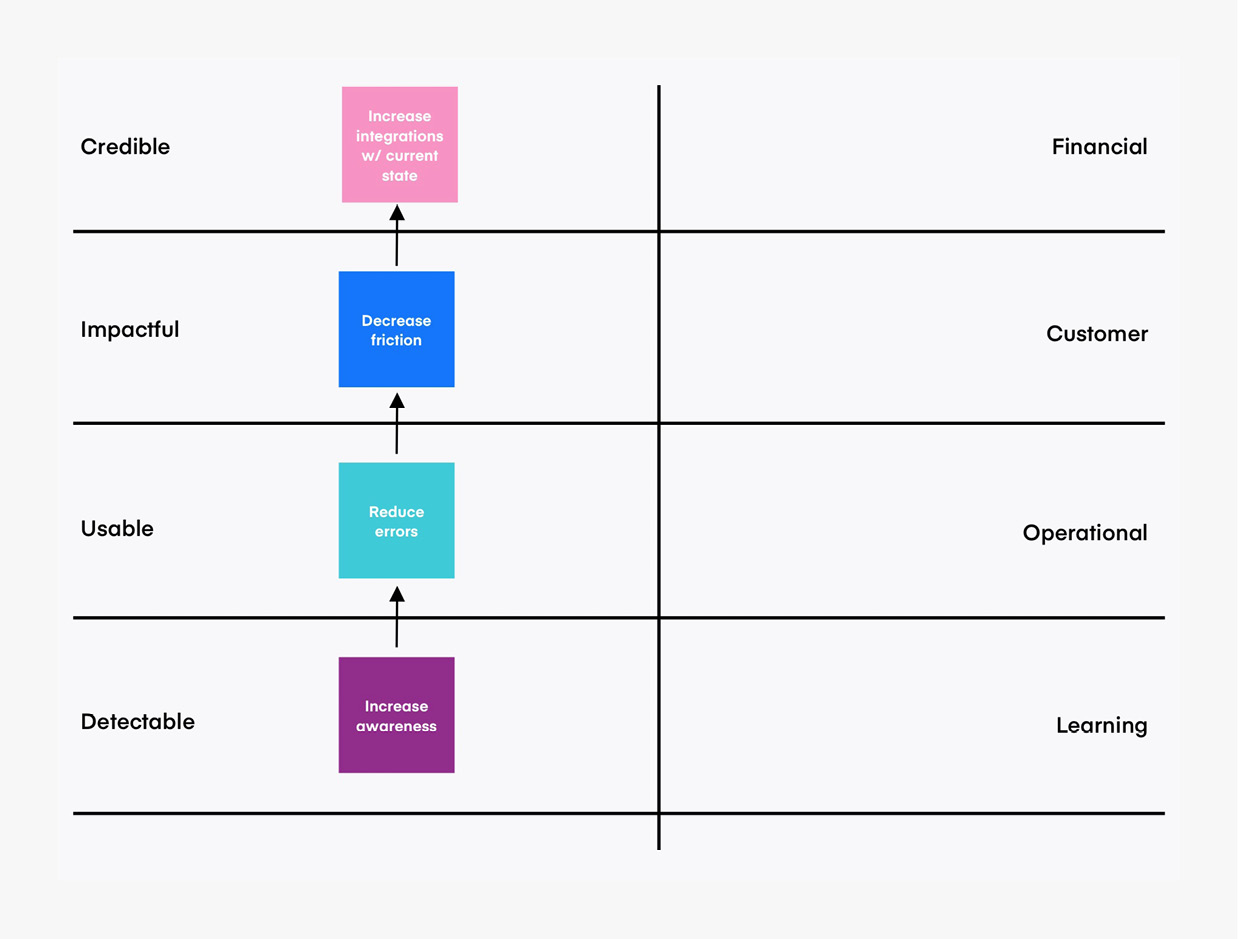 Figure 4-7: The cause-and-effect model of desirability objectives by Ryan Rumsey
In the viability column, capture the objectives of the product you’re working on and align them to the viability perspectives. Typically, these objectives come from your product partners or team leaders. If you don’t know the strategic objectives for your product or service, you can use the Strategy Map approach with your product manager to visualize what they might be.
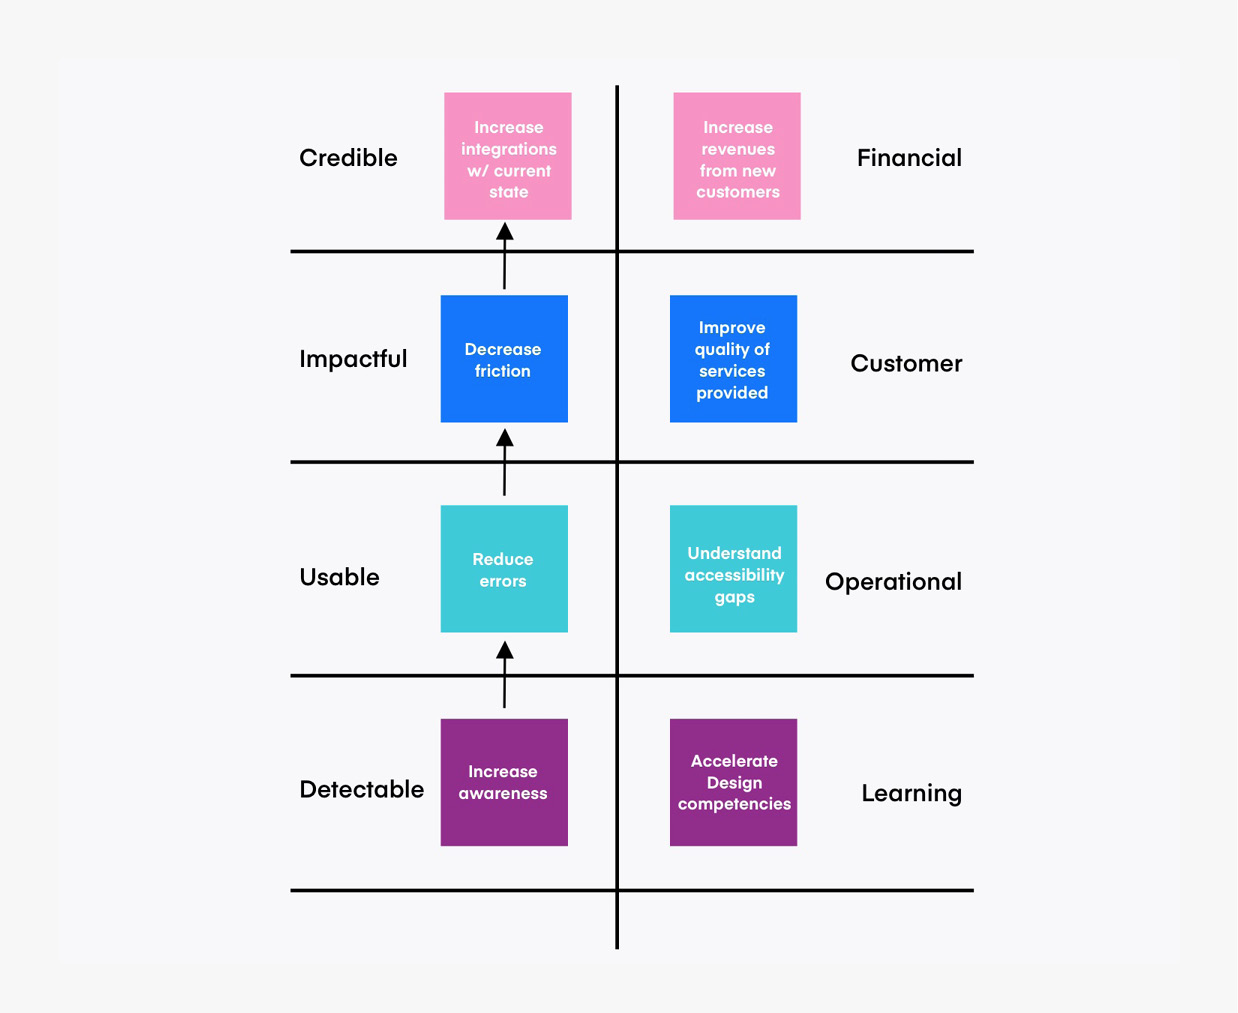
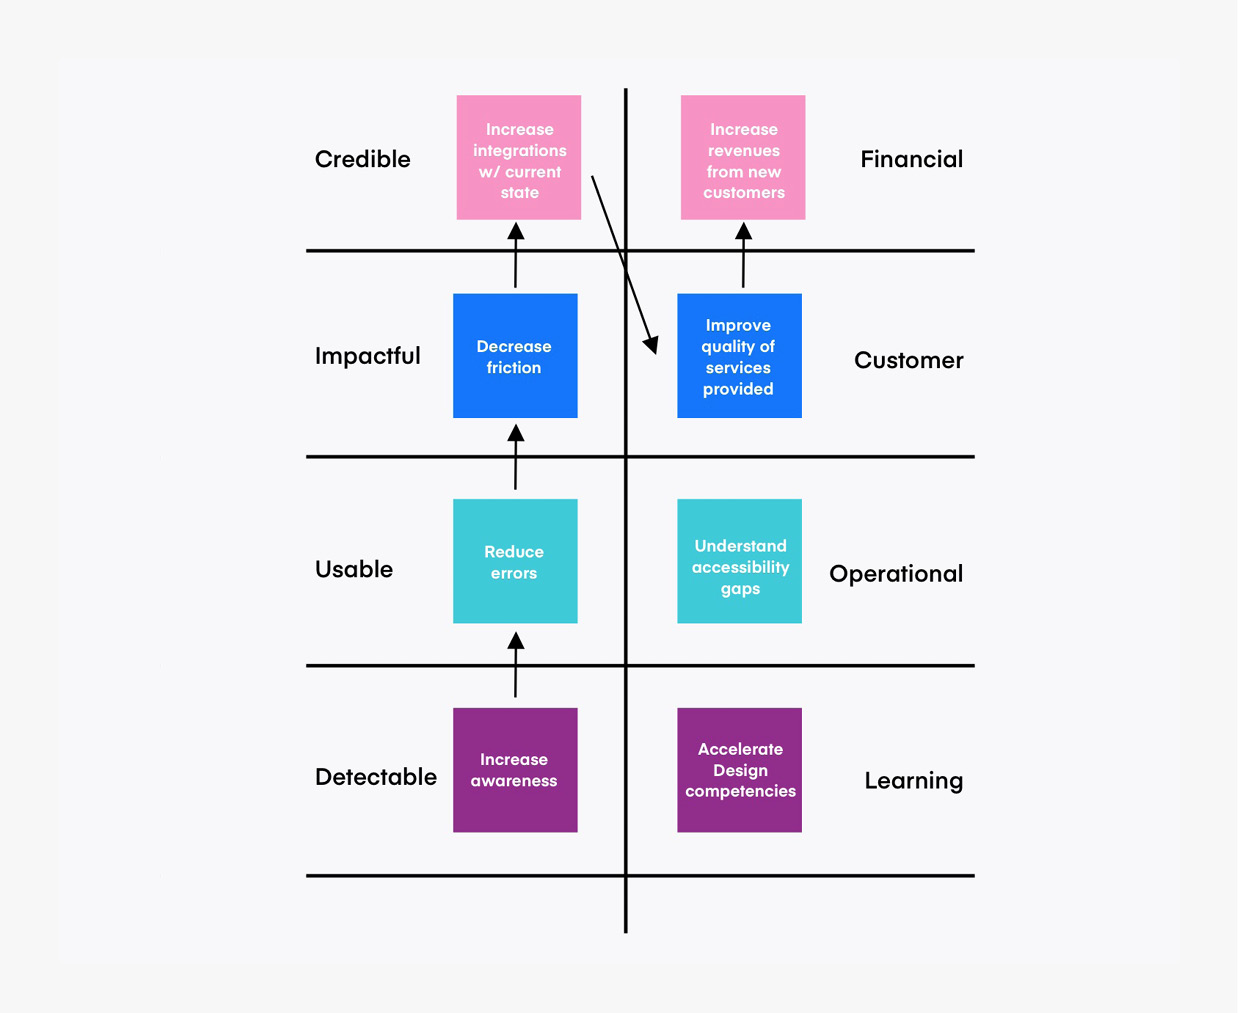 Figure 4-8, 4-9: The cause-and-effect model of desirability and viability objectives by Ryan Rumsey
Once you have objectives in both columns, use additional arrows to extend your conditional statement into the adjacent column by connecting credibility to an objective of viability. As seen below in figure 4-11, you now have a succinct statement of why desirability matters for customer adoption and viability.
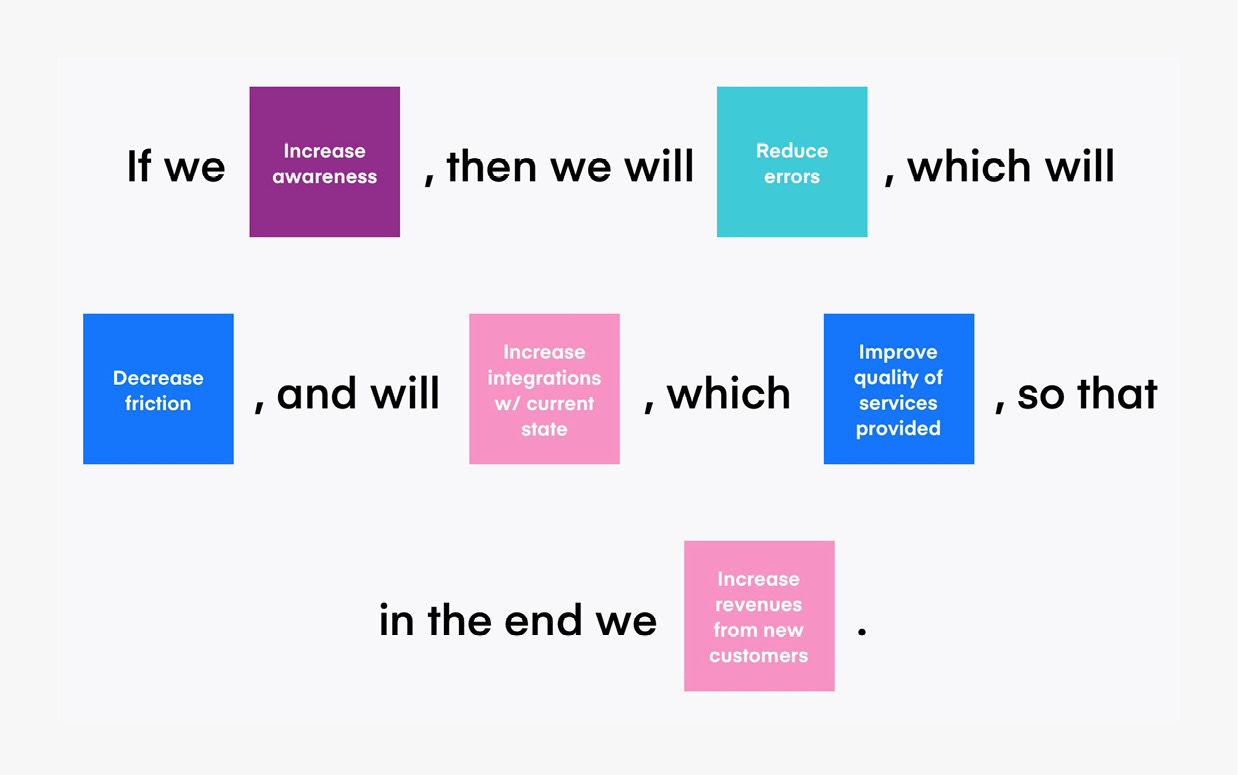 Figure 4-10: A concise and succinct statement to connect desirability to viability by Ryan Rumsey
Congratulations! You’ve just connected design to business and desirability to viability! These conditional statements are now the perfect set-up to frame better experiments moving forward. These experiments are where our next topic—measures and metrics—comes into play.
Pro tip
Prototype your cause-and-effect models with Post-its and Sharpies. It’s the easiest (and cheapest) way to get alignment for teams and stakeholders.
Track goals with experimentation
Design teams at high maturity levels find ways to quantify the value of design to the larger organization through experimentation. These teams create experiments that measure desirability and viability. They also understand that experimentation leads to active learning and the establishment of trust with their colleagues.
Experimentation is, at its core, about active learning and value creation. To thrive, your team must learn faster than the competition AND convert that learning into value faster than the competition.
- John Cutler, Product Evangelist at Amplitude
The key to creating good product experiments is to start with two viability goals at once: a primary goal that changes and a secondary goal that stays the same. In other words, the primary goal is something the team wants to achieve without losing something else.
For example: Our (primary) goal is to increase revenue while keeping costs the same (secondary).
The key to creating great product experiments is to consider two viability goals AND two desirability goals at the same time. One of my favorite methods for validating these types of experiments is described in the book Designing with Data by Elizabeth F. Churchill, Rochelle King, and Caitlin Tan.
A top-down approach for experimentation
Using this structure, product teams have a format to shape multiple hypotheses regarding desirability factors within an experiment.
While the overall purpose of each experiment is to validate whether or not a solution is viable, the purpose of testing different approaches is to validate the degree of viability in relation to desirability goals.
When it comes to measurements, we’re fortunate to have the work of many design leaders who have written on the topic. Whether we use Key Experience Indicators, Usability, Credibility, or other measures, it’s critical to track the effects of your experiments both quantitatively and qualitatively. Having an imbalance in either direction leads to a lot of guessing.
If this top-down approach to experimentation seems too robust for your team’s current maturity level, there’s a simpler approach that also produces good results.
An inside-out approach to experimentation
The inside-out approach to experimentation is one I regularly use. But beware! It involves the question so many designers dread: “What’s the ROI of this?”
Return on Investment (ROI) is one of those conversations many designers aren’t prepared to have. So let’s break it down. When organizations invest in making new products, executives and sponsors want to know four things:
- What do I get?
- How much do I get?
- When do I get it?
- How much will it cost me?
While executives expect to have answers for these four questions, rarely do they ask them and that creates a major communication gap.
When ROI conversations arise (and they will) it’s not only important to communicate if a design works, but also by how much. The degree to which a design is successful is an important factor in making decisions about investment. This is what your business partners mean when they ask about the ROI.
Believe it or not, the easiest way to answer the ROI question is to start with math assumptions. Perhaps you’ve avoided math in your career. I did. But it’s going to be OK, because your responsibility is only to highlight when the math doesn’t add up, not to calculate it. Let me explain.
Math must be used to calculate ROI. If math isn’t being used, your business partners are just guessing. There’s no way for you to calculate ROI on desirability factors if the product and business folks around you don’t have legitimate numbers for you to start with. I like to say, If math is being used, it’s your job to highlight how desirability is impacting the math. If math is not being used, it’s your job to highlight the risks of not using it.
ROI calculations for digital products are pretty standard. From calculating marketing efforts to rates of retention, organizations use math to determine which solutions are viable or not. By framing experiments around ROI, product teams get scenarios of how well a design worked, which helps them make trade-off decisions.
You’ve stuck with me thus far, so let’s talk about how to crunch the numbers.
Let’s talk quantification!
When numbers do exist, you’re in a great position. Now, when you conduct experiments with specific desirability measurements, your product partners will be better able to calculate viability. Together, these numbers will make a strong case in trade-off decisions.
To get a baseline for quantification, let’s look at an equation for calculating the percentage of customers a company keeps and “retains” over time. To calculate the ROI of Retention, you need four metrics:
- The number of customers you’re targeting
- The current percentage rate of retention
- The projected rate of retention
- The projected rate of retention
Pro tip
Once you know what metrics responsible businesses should be calculating, you can ask whether or not the numbers exist in your company and what numeric goals the organization targets.
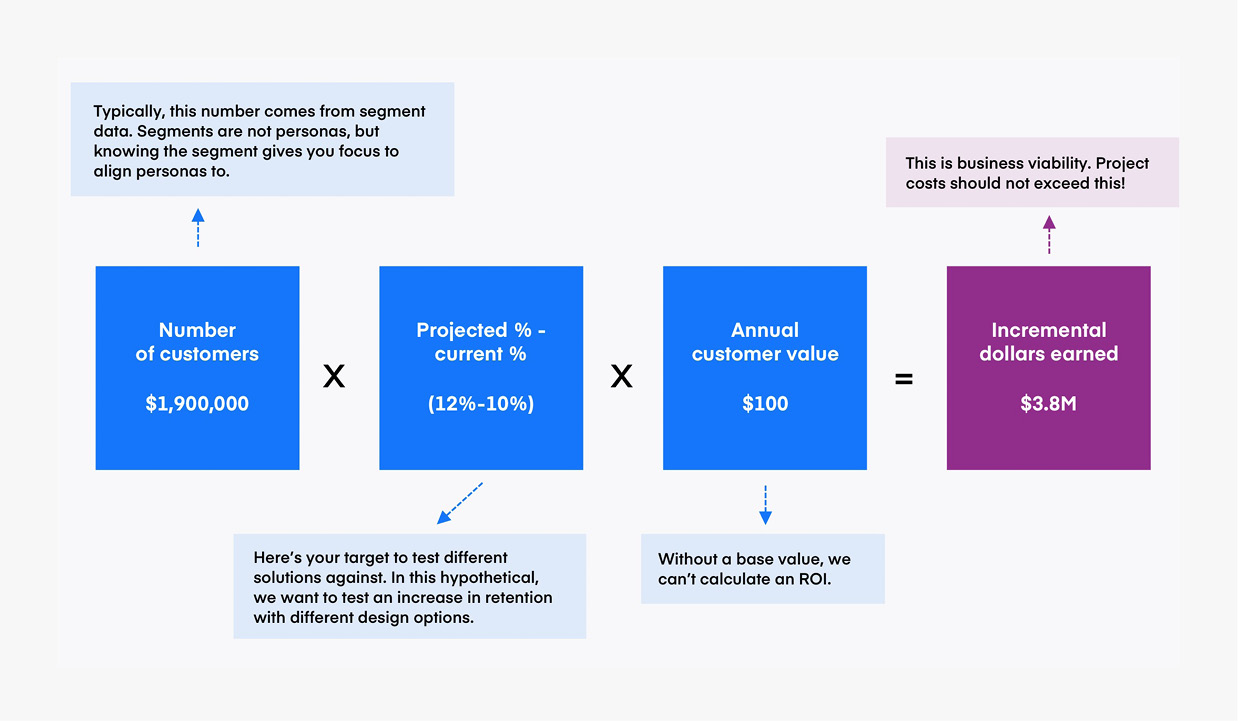 Figure 4-11: Designing for the ROI of Retention equation by Ryan Rumsey
Using ROI formulas is a great way to validate that math is being used and frame experiments for desirability. From looking at the formula in figure 4-1113, you can identify three crucial insights:
- The potential dollars earned for this model is $3.8 million. That’s the target for viability. The project costs involved should not exceed $3.8 million unless value is created in another way.
- 1.9 million customers is a number that typically comes from segmentation data. While segments are not personas, this audience is where the business assumes a competitive advantage can be created. Having a target audience allows designers to focus on personas specific to that segment and to either validate or push back on the assumption.
- Projected and current percentages of retention indicate the viability outcome for an experiment. It’s a target to test different solutions against and in this hypothetical equation, your experiments should test if a desirability metric helps increase retention from 10 to 12%.
Pro tip
Ask your product managers how they’re calculating ROI. To break the ice, you can show them an example formula.
Conclusion
Making minor pivots in how you discuss design work is how you’ll prepare your organization for increased maturity. If your partners ask why you’re not doing what Amazon is doing, tell them you’re not designing for Amazon’s values or customers. But remember, what your business partners really want is viability for the company. So be prepared to take the conversation a step further by showing how the desirability you create connects to viability. Connecting those outcomes isn’t easy, but it must be done.
Also, know that companies support non-traditional factors like accessibility or openess when designers can show that these factors create competitive advantages. This pivot, from describing “what design is” to talking about the “competitive advantages design work provides” benefits both your organization and your customers. And it builds trust.
Further reading
- Four "fits" to make Design crucial at your company
- Designing with Data by Elizabeth F. Churchill, Rochelle King, and Caitlin Tan
- A Strategy Maps 101 video by strategy and performance management specialist Phil Jones
- The New Design Frontier report from InVision